Momtum
A dashboard that saves GitHub traffic data for good, long after GitHub's fourteen day window closes.
Summary
Overview
Momtum tracks traffic and stats for twelve repositories on one page. GitHub serves traffic data for fourteen days and no longer. So the dashboard keeps its own copy. Once a week it writes the window down, and a fortnight of numbers becomes a record that reaches back to the week it started. It was built for one person's repositories.
Challenge
GitHub's traffic API returns a trailing fourteen days and resets as you read it. There is no call that returns last month. Either something writes the window down each week or the history does not exist, and the thing doing the writing is handling text that strangers can edit.
Process
Views, clones, referrers and paths, pulled per repository on a weekly cadence and written as one document each. Fourteen days is the whole of what GitHub keeps, so the cadence is set by the retention, not by preference.
The sync runs in two phases that do not share a view of the data. A shell script does the fetching and writes files; a model with one tool and no shell does the writing, and is handed paths rather than contents.
Six aggregate tiles, a year of contributions, and a card per repository that opens into traffic over time, commit volume, and where the visits came from. Visibility and sort are filters rather than separate views.
A run that fails rather than advancing its own clock, so a week it could not finish is tried again instead of being recorded as done.
Fourteen Days, Then Gone
GitHub will tell you who visited a repository, what they cloned and where they came from. It will tell you for fourteen days. Ask on the fifteenth and the first day is gone, and no parameter asks for last month.
A fortnight is reasonable for an API and too short to show a trend. The only way to have the history is to have written it down while it was still being served.
The screens here run on generated data, which is what the badge beside the date says. The real dashboard tracks a dozen repositories, several of them private and one of them a client's, so the numbers below are made up and the shapes are not.
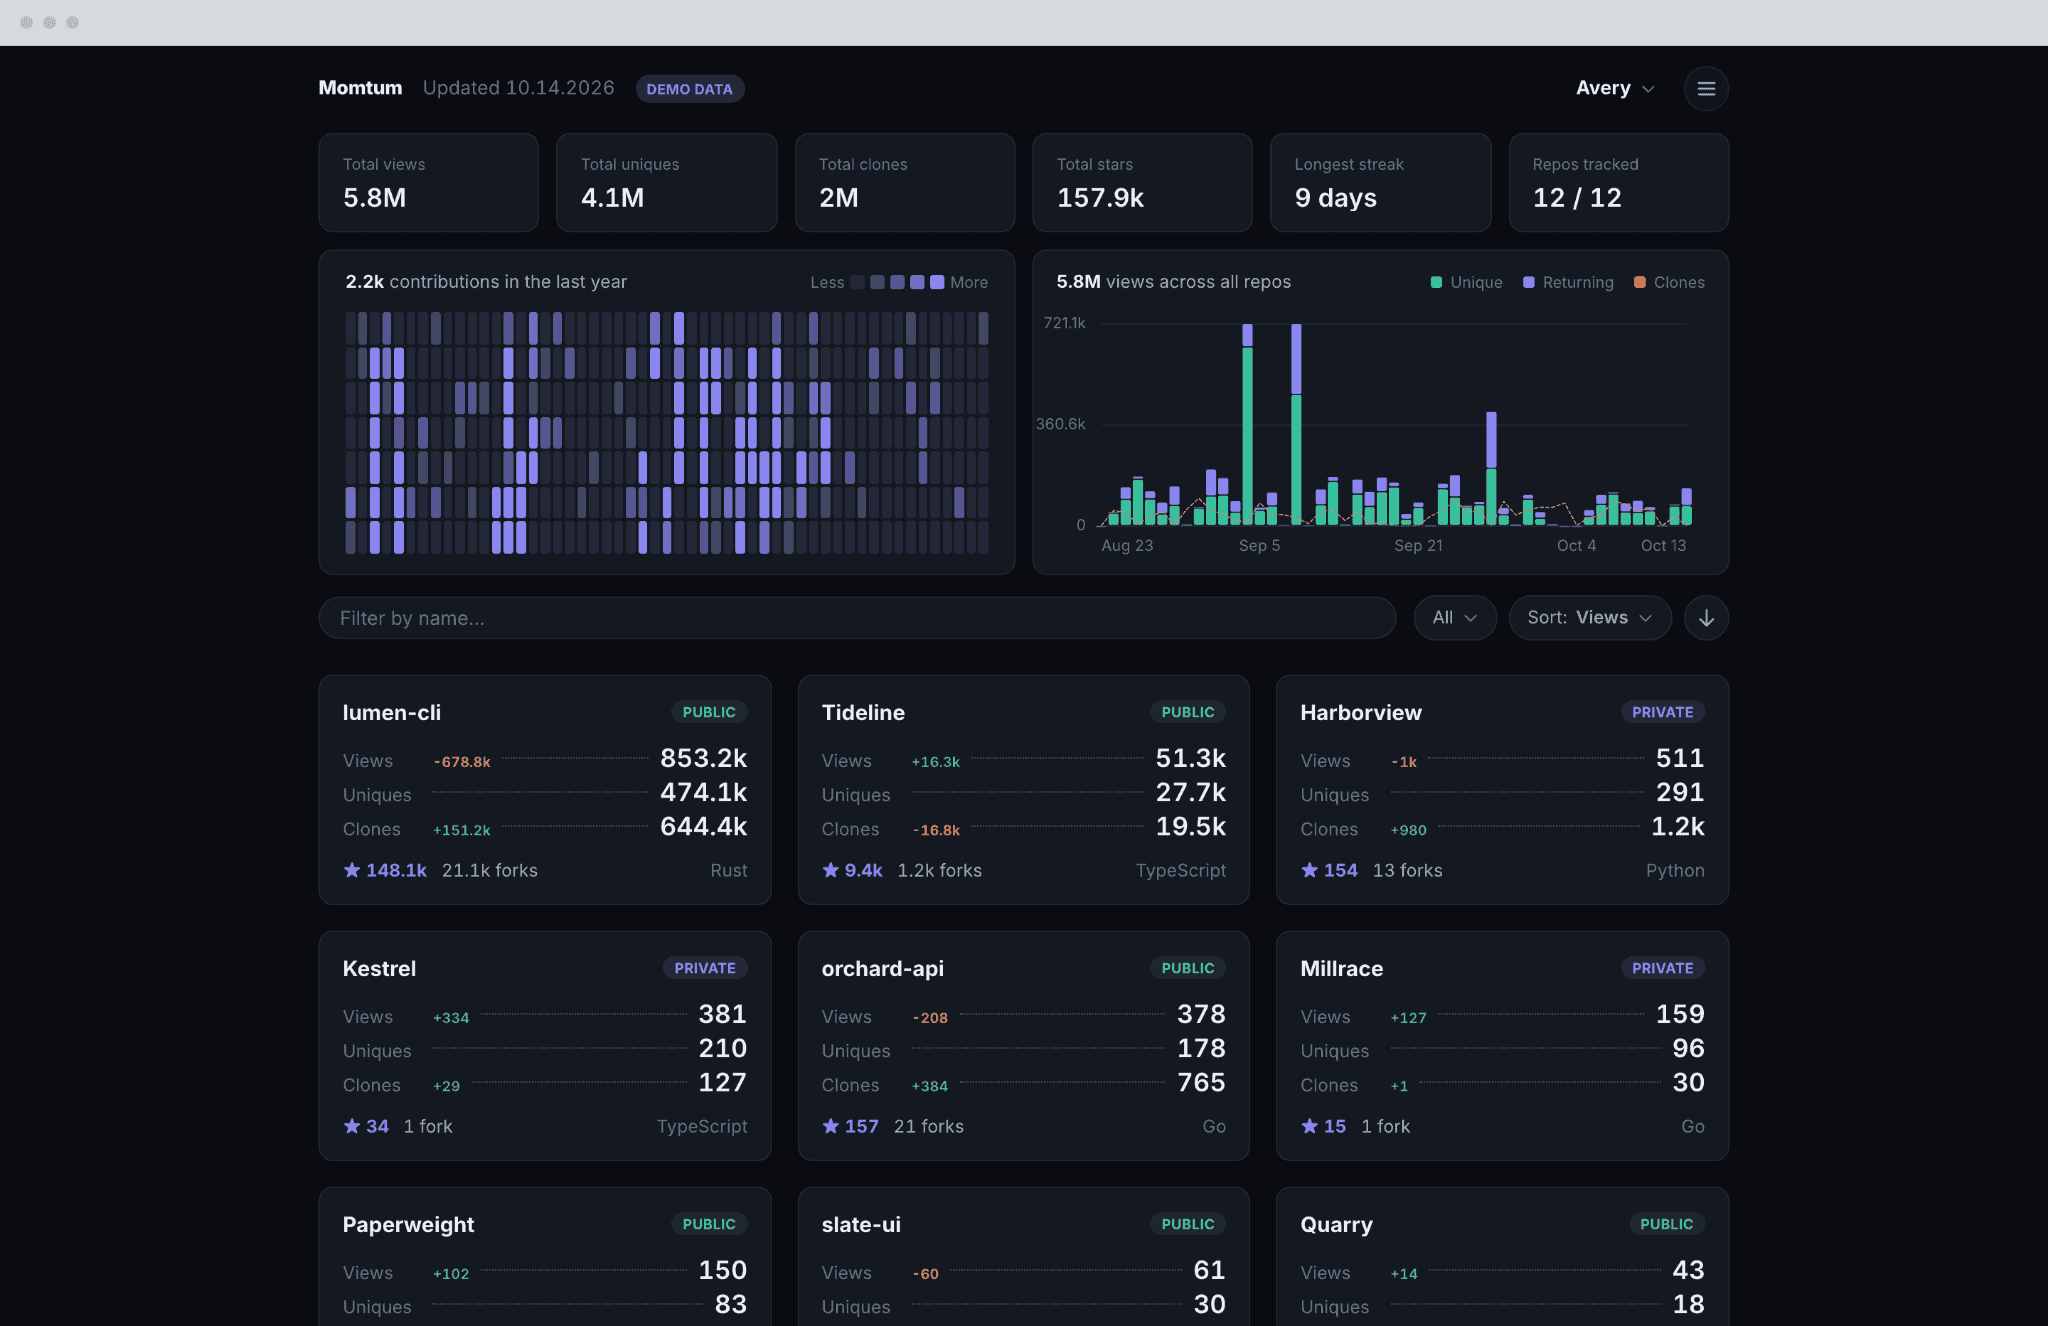
One List, Filtered in Place
Visibility, sort and search filter one grid, not three views of it. Type into the field and the cards narrow while the totals above them hold: the totals are the account, the grid is the question being asked of it.
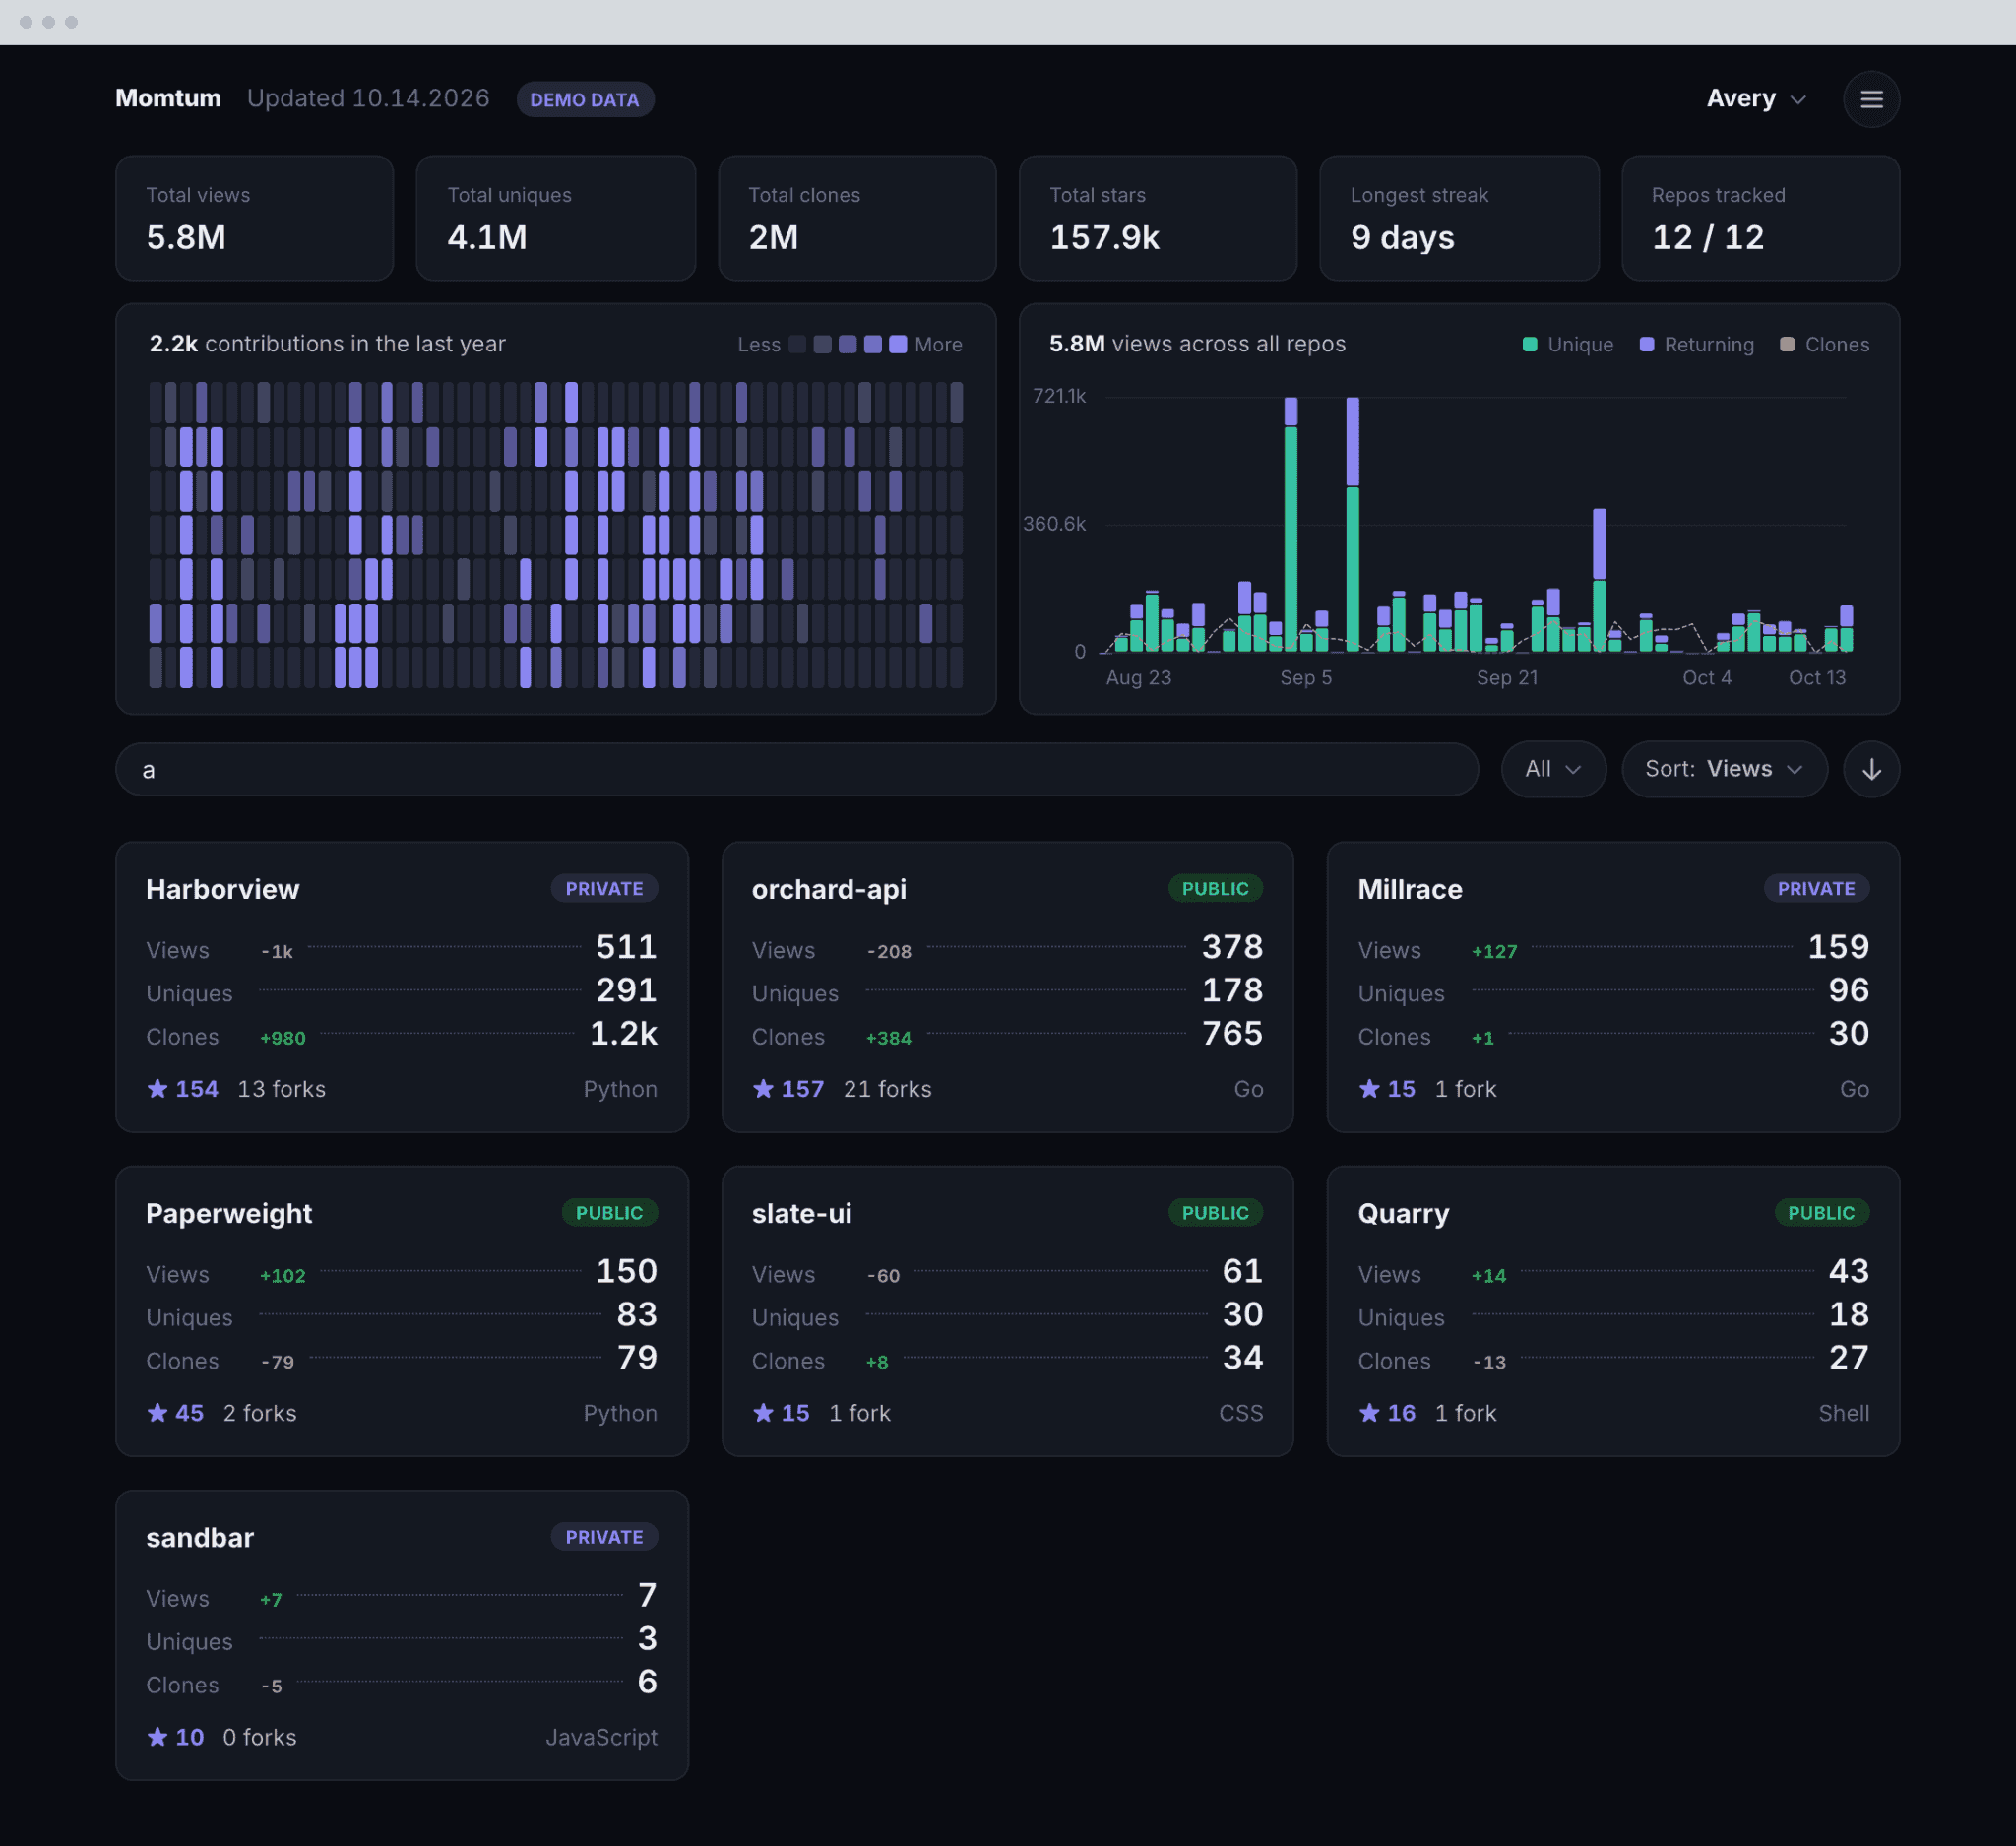
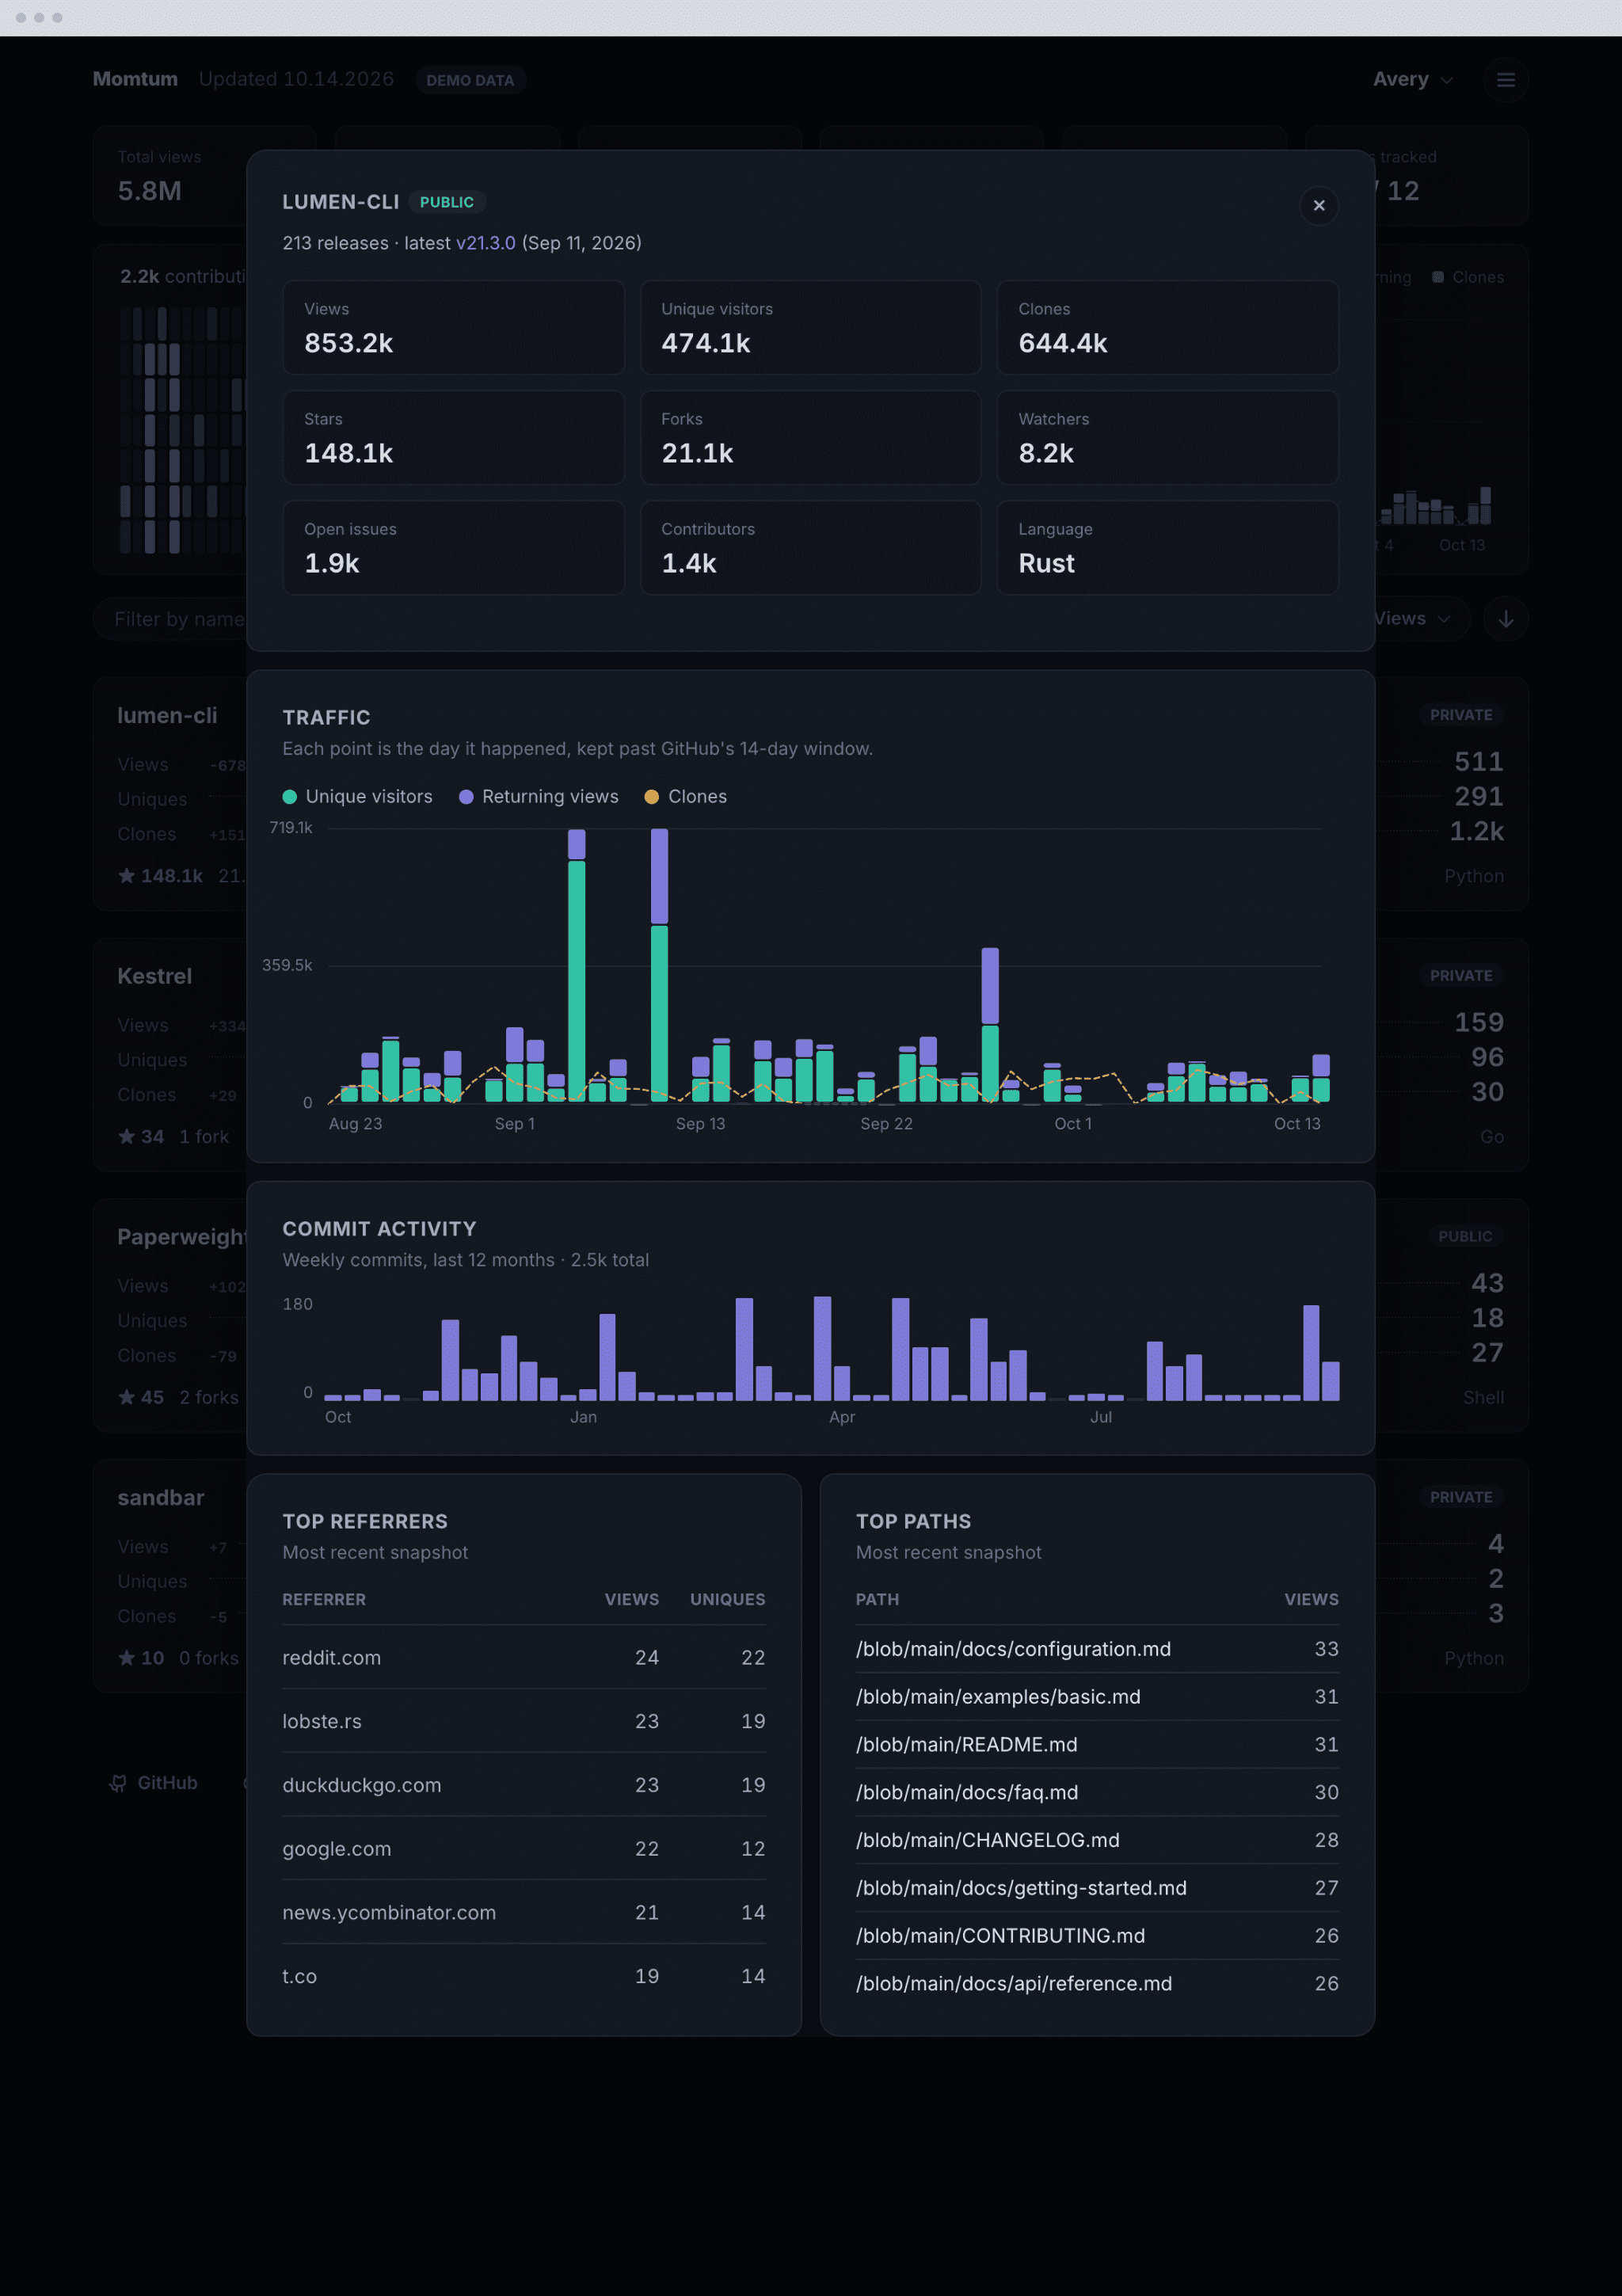
What a Card Opens Into
A card opens on the thing the snapshots buy. Unique visitors, returning views and clones run day by day across every week ever collected, and each point carries the date it happened on, not the date it was captured. Referrers and paths come from the most recent snapshot, because those are the two GitHub resets the hardest.
Drawn Twice, Not Inverted
The dashboard opens dark, which is where it gets used: a tab left open beside the work it reports on. The light theme is the whole page drawn again, and the accent moves with it, because the value that reads on a dark ground does not read on a pale one.
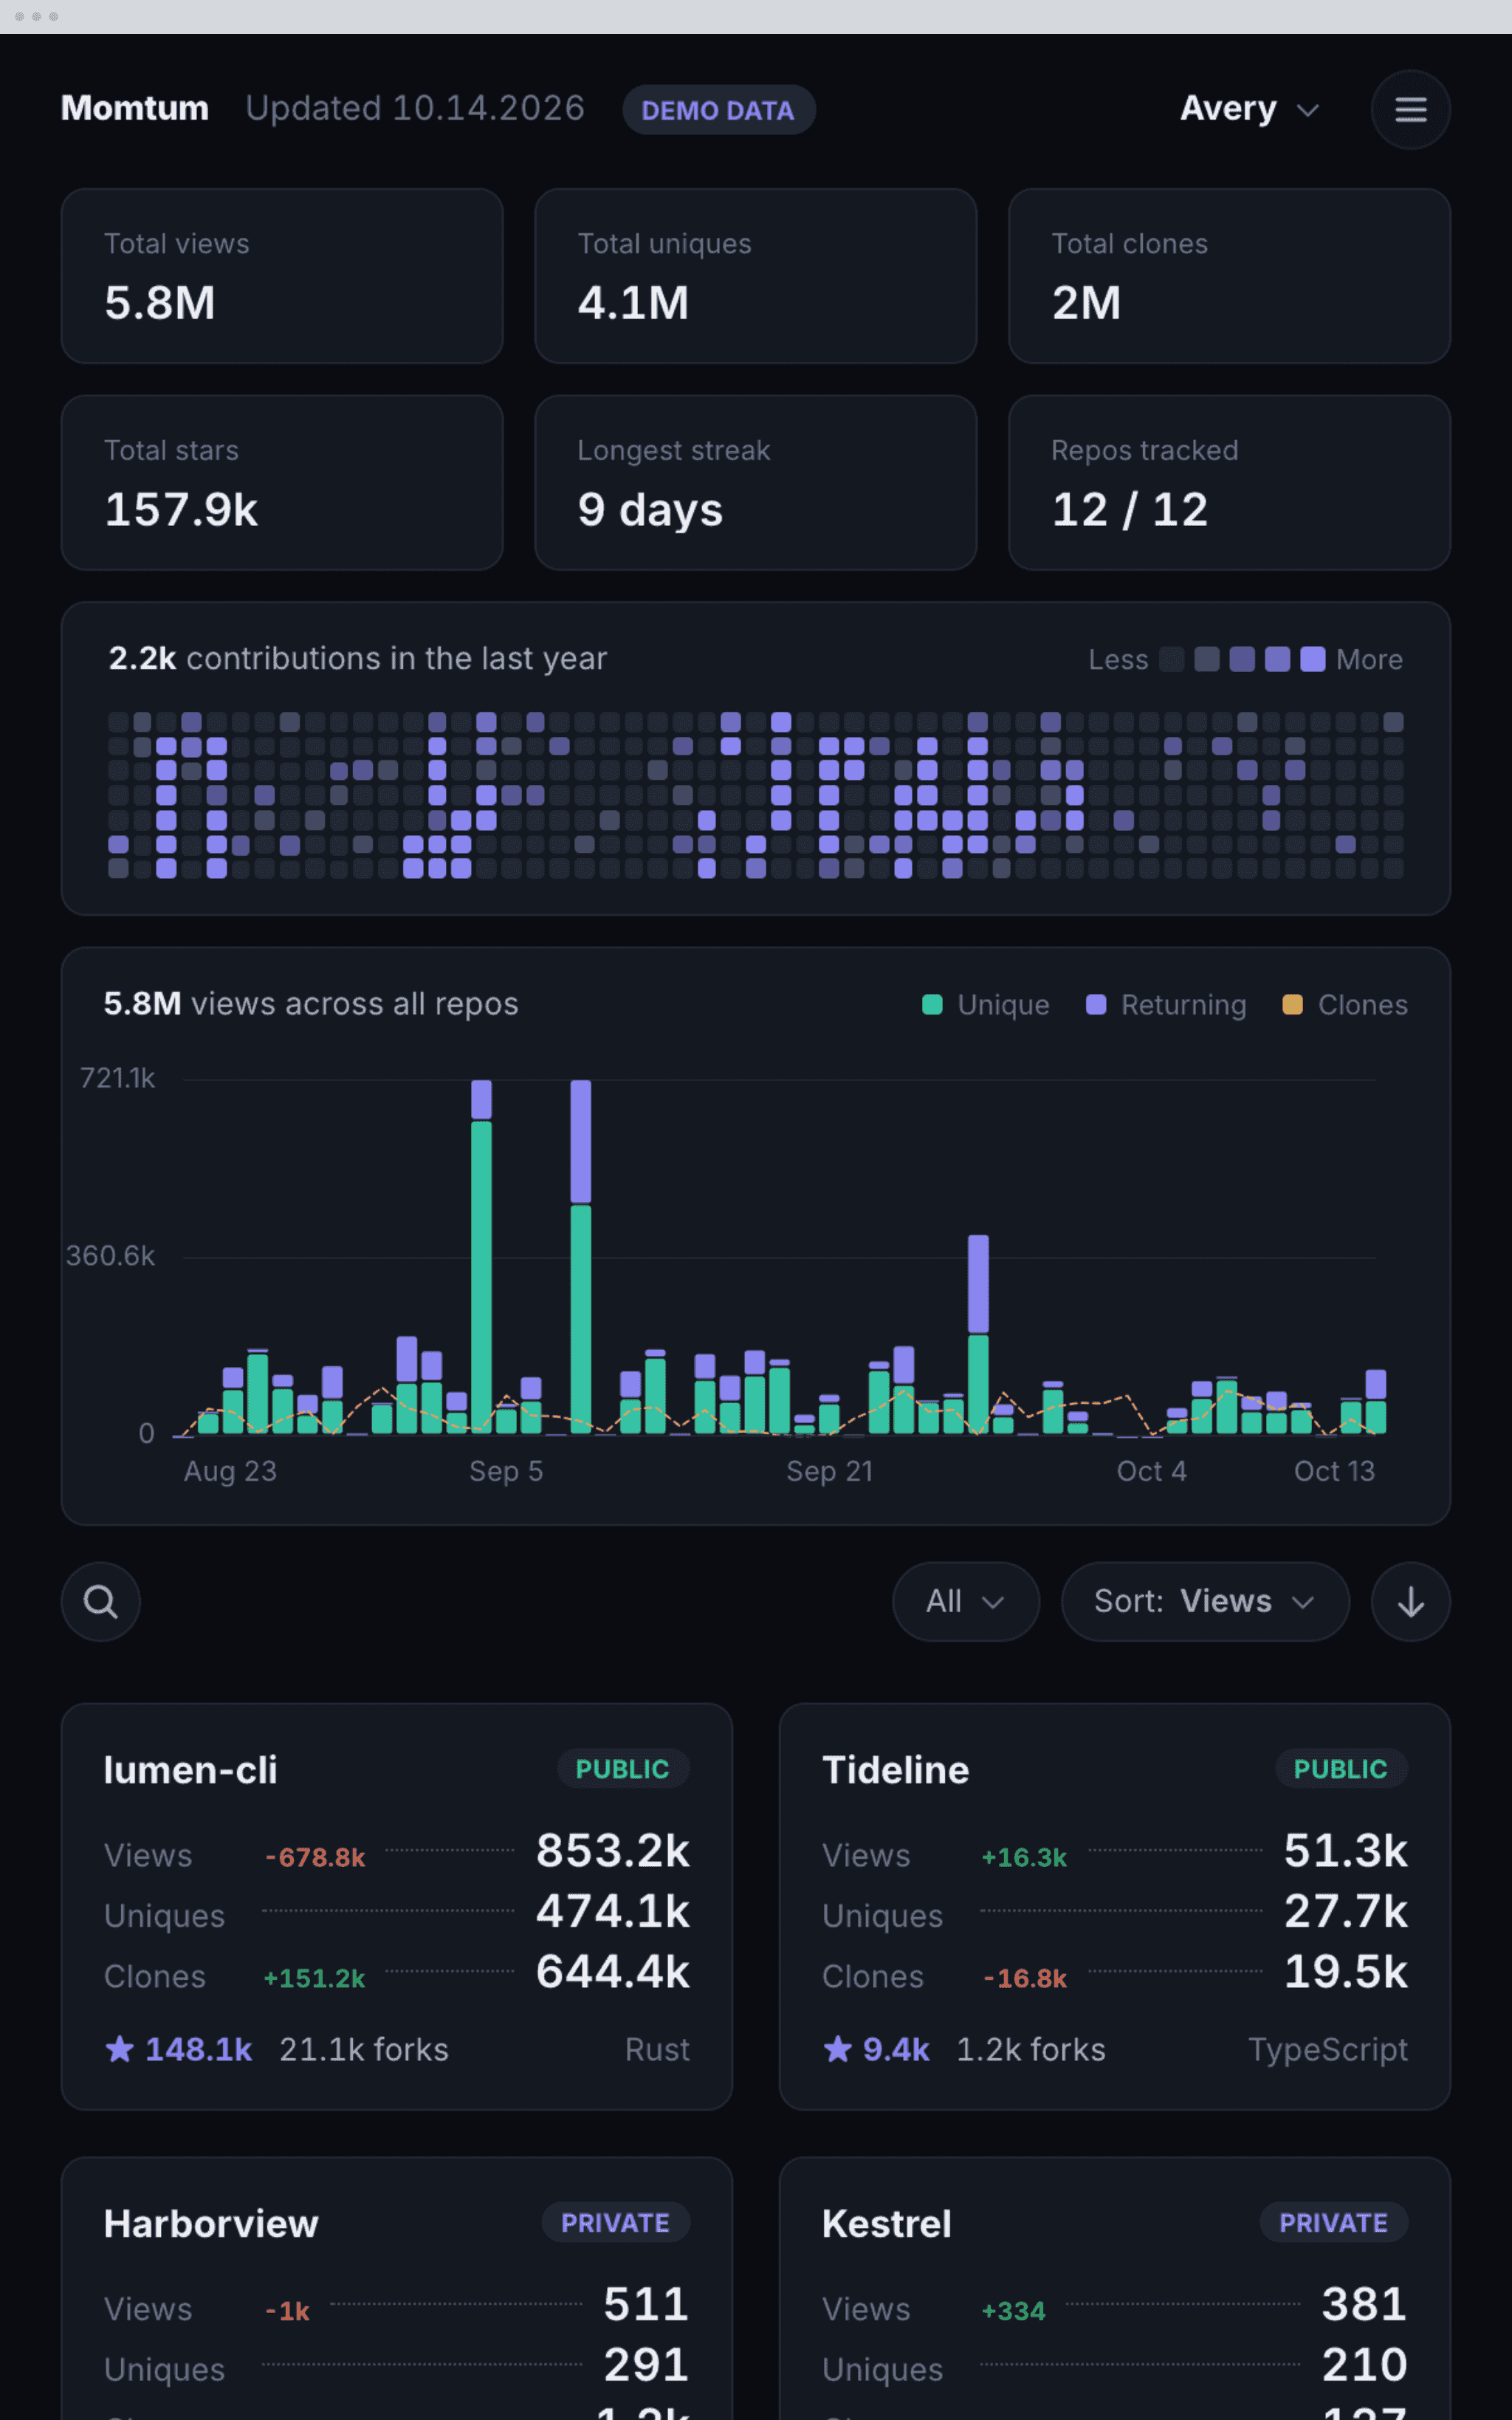
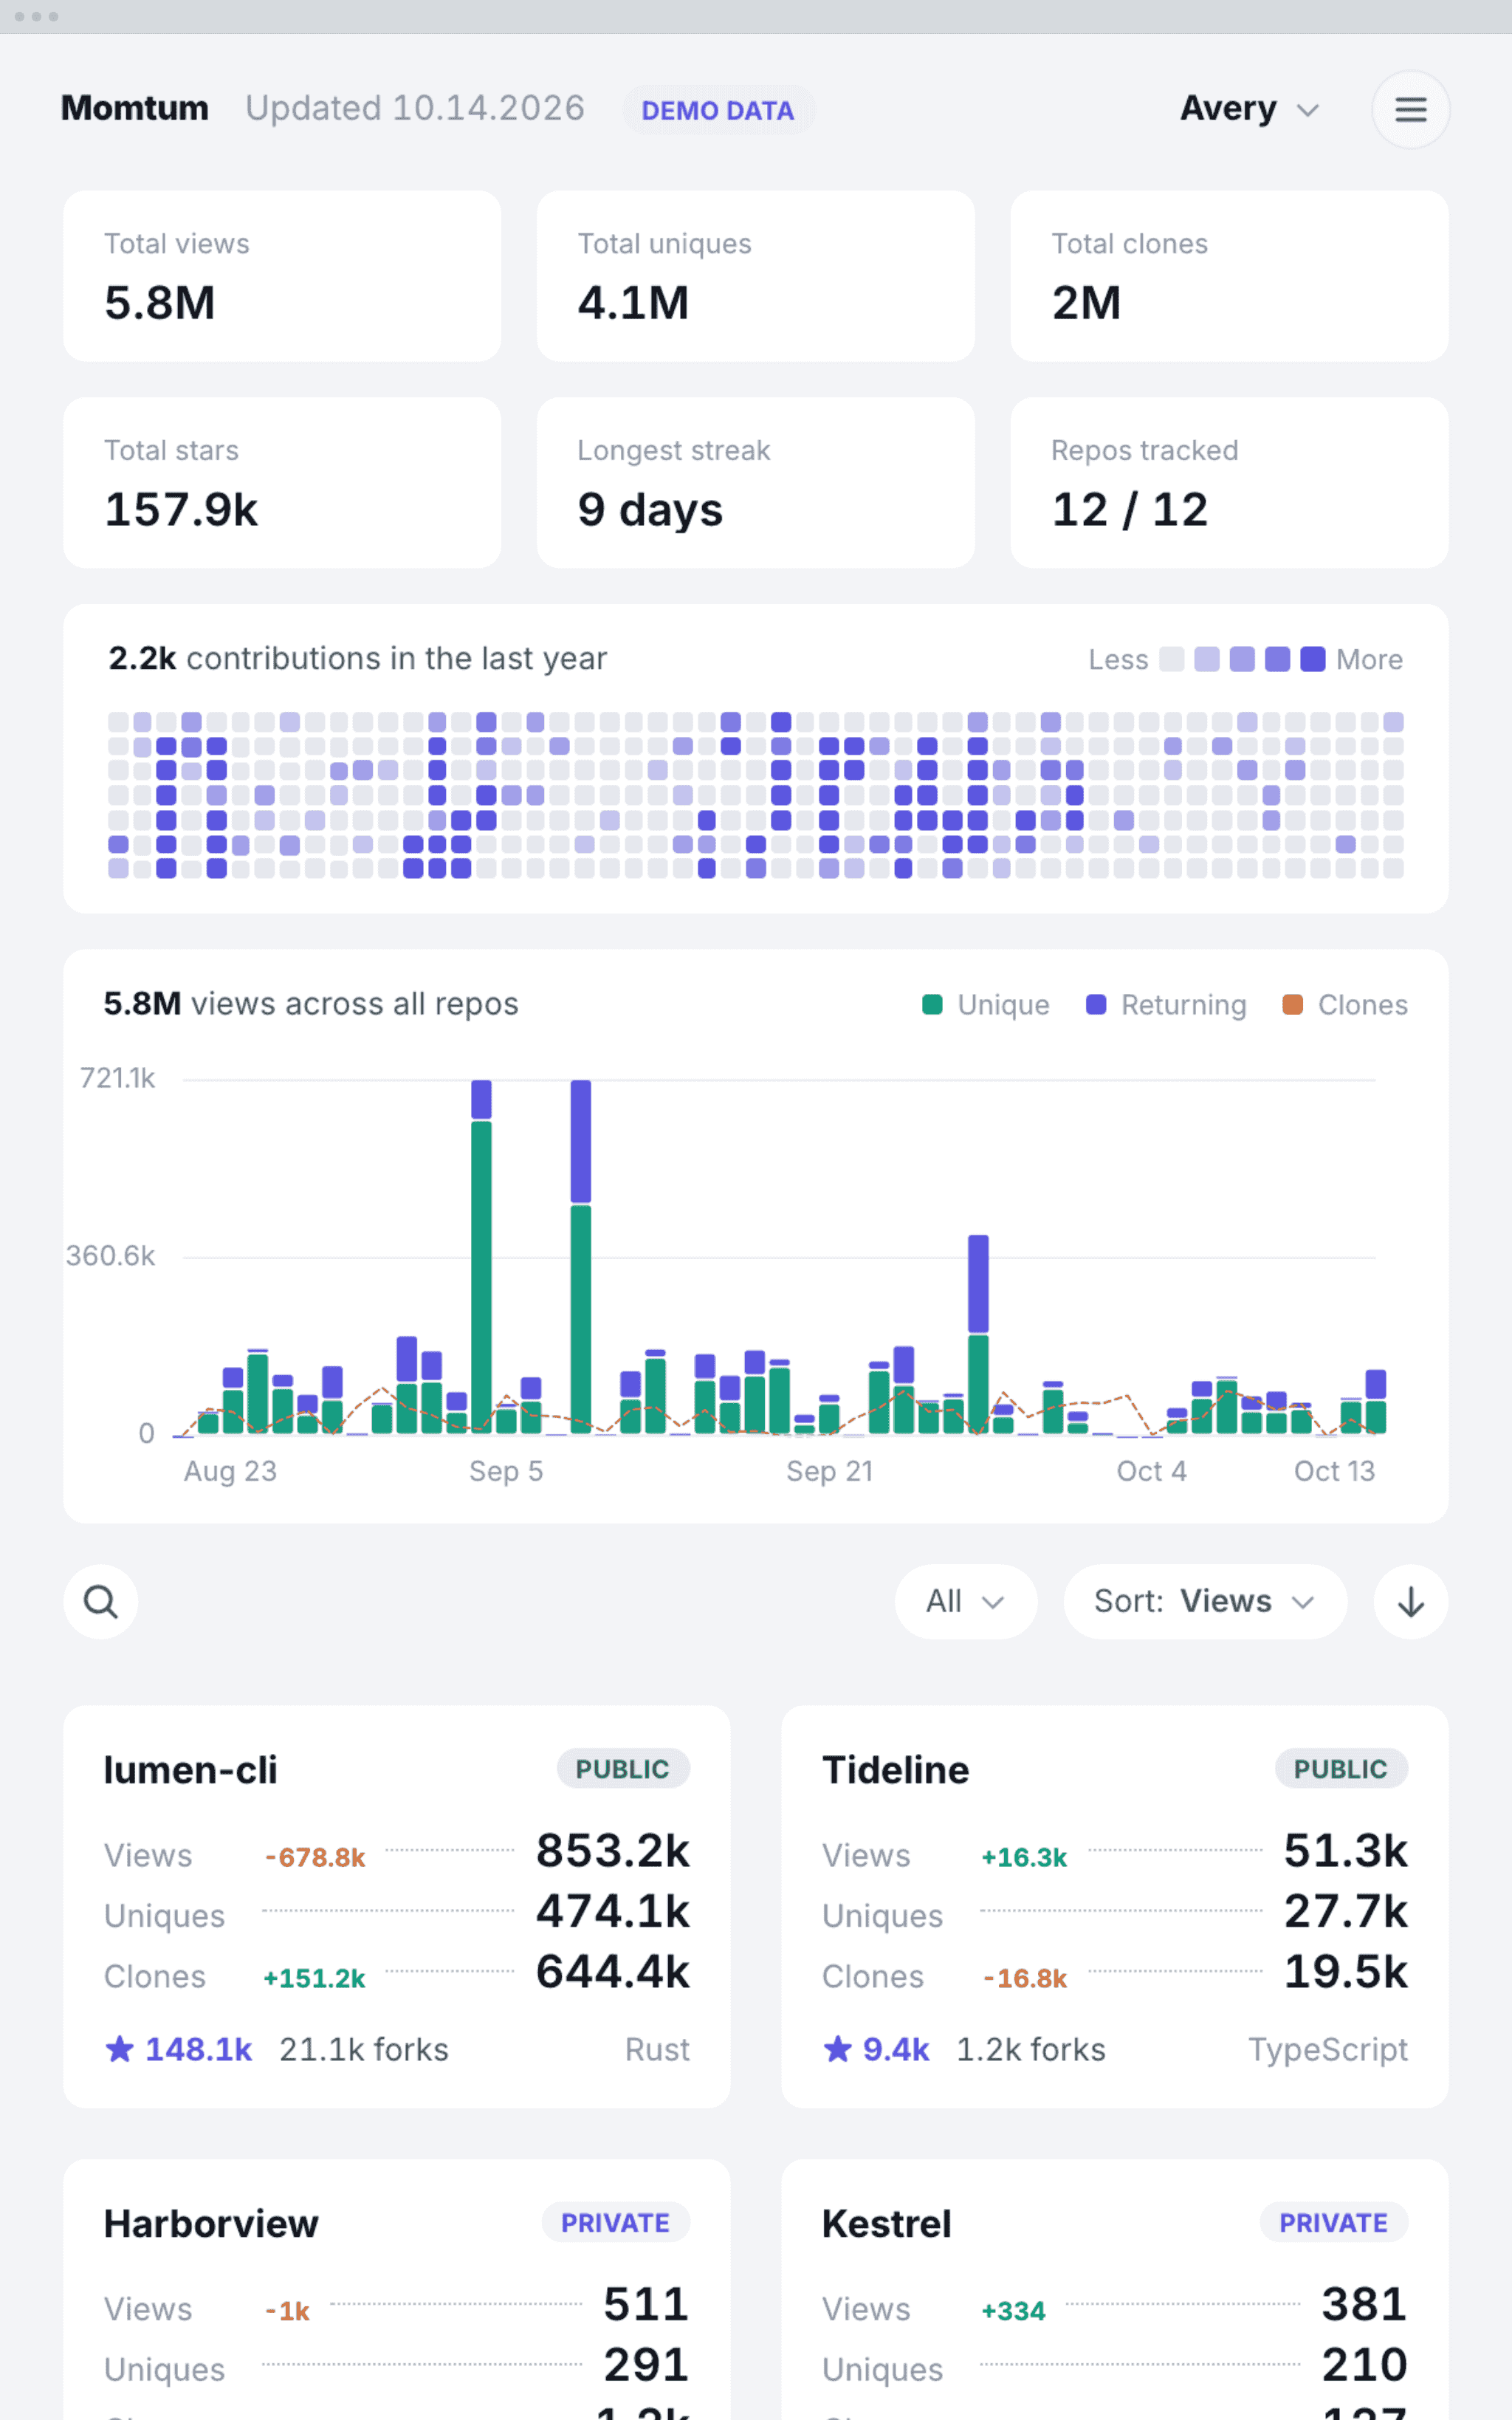
Everything, One Column Down
At phone width the tiles go two across, the year of contributions compresses, the search gives up its field for its icon, and the repository grid stacks. Nothing is dropped, which matters for a dashboard somebody checks on the way somewhere.
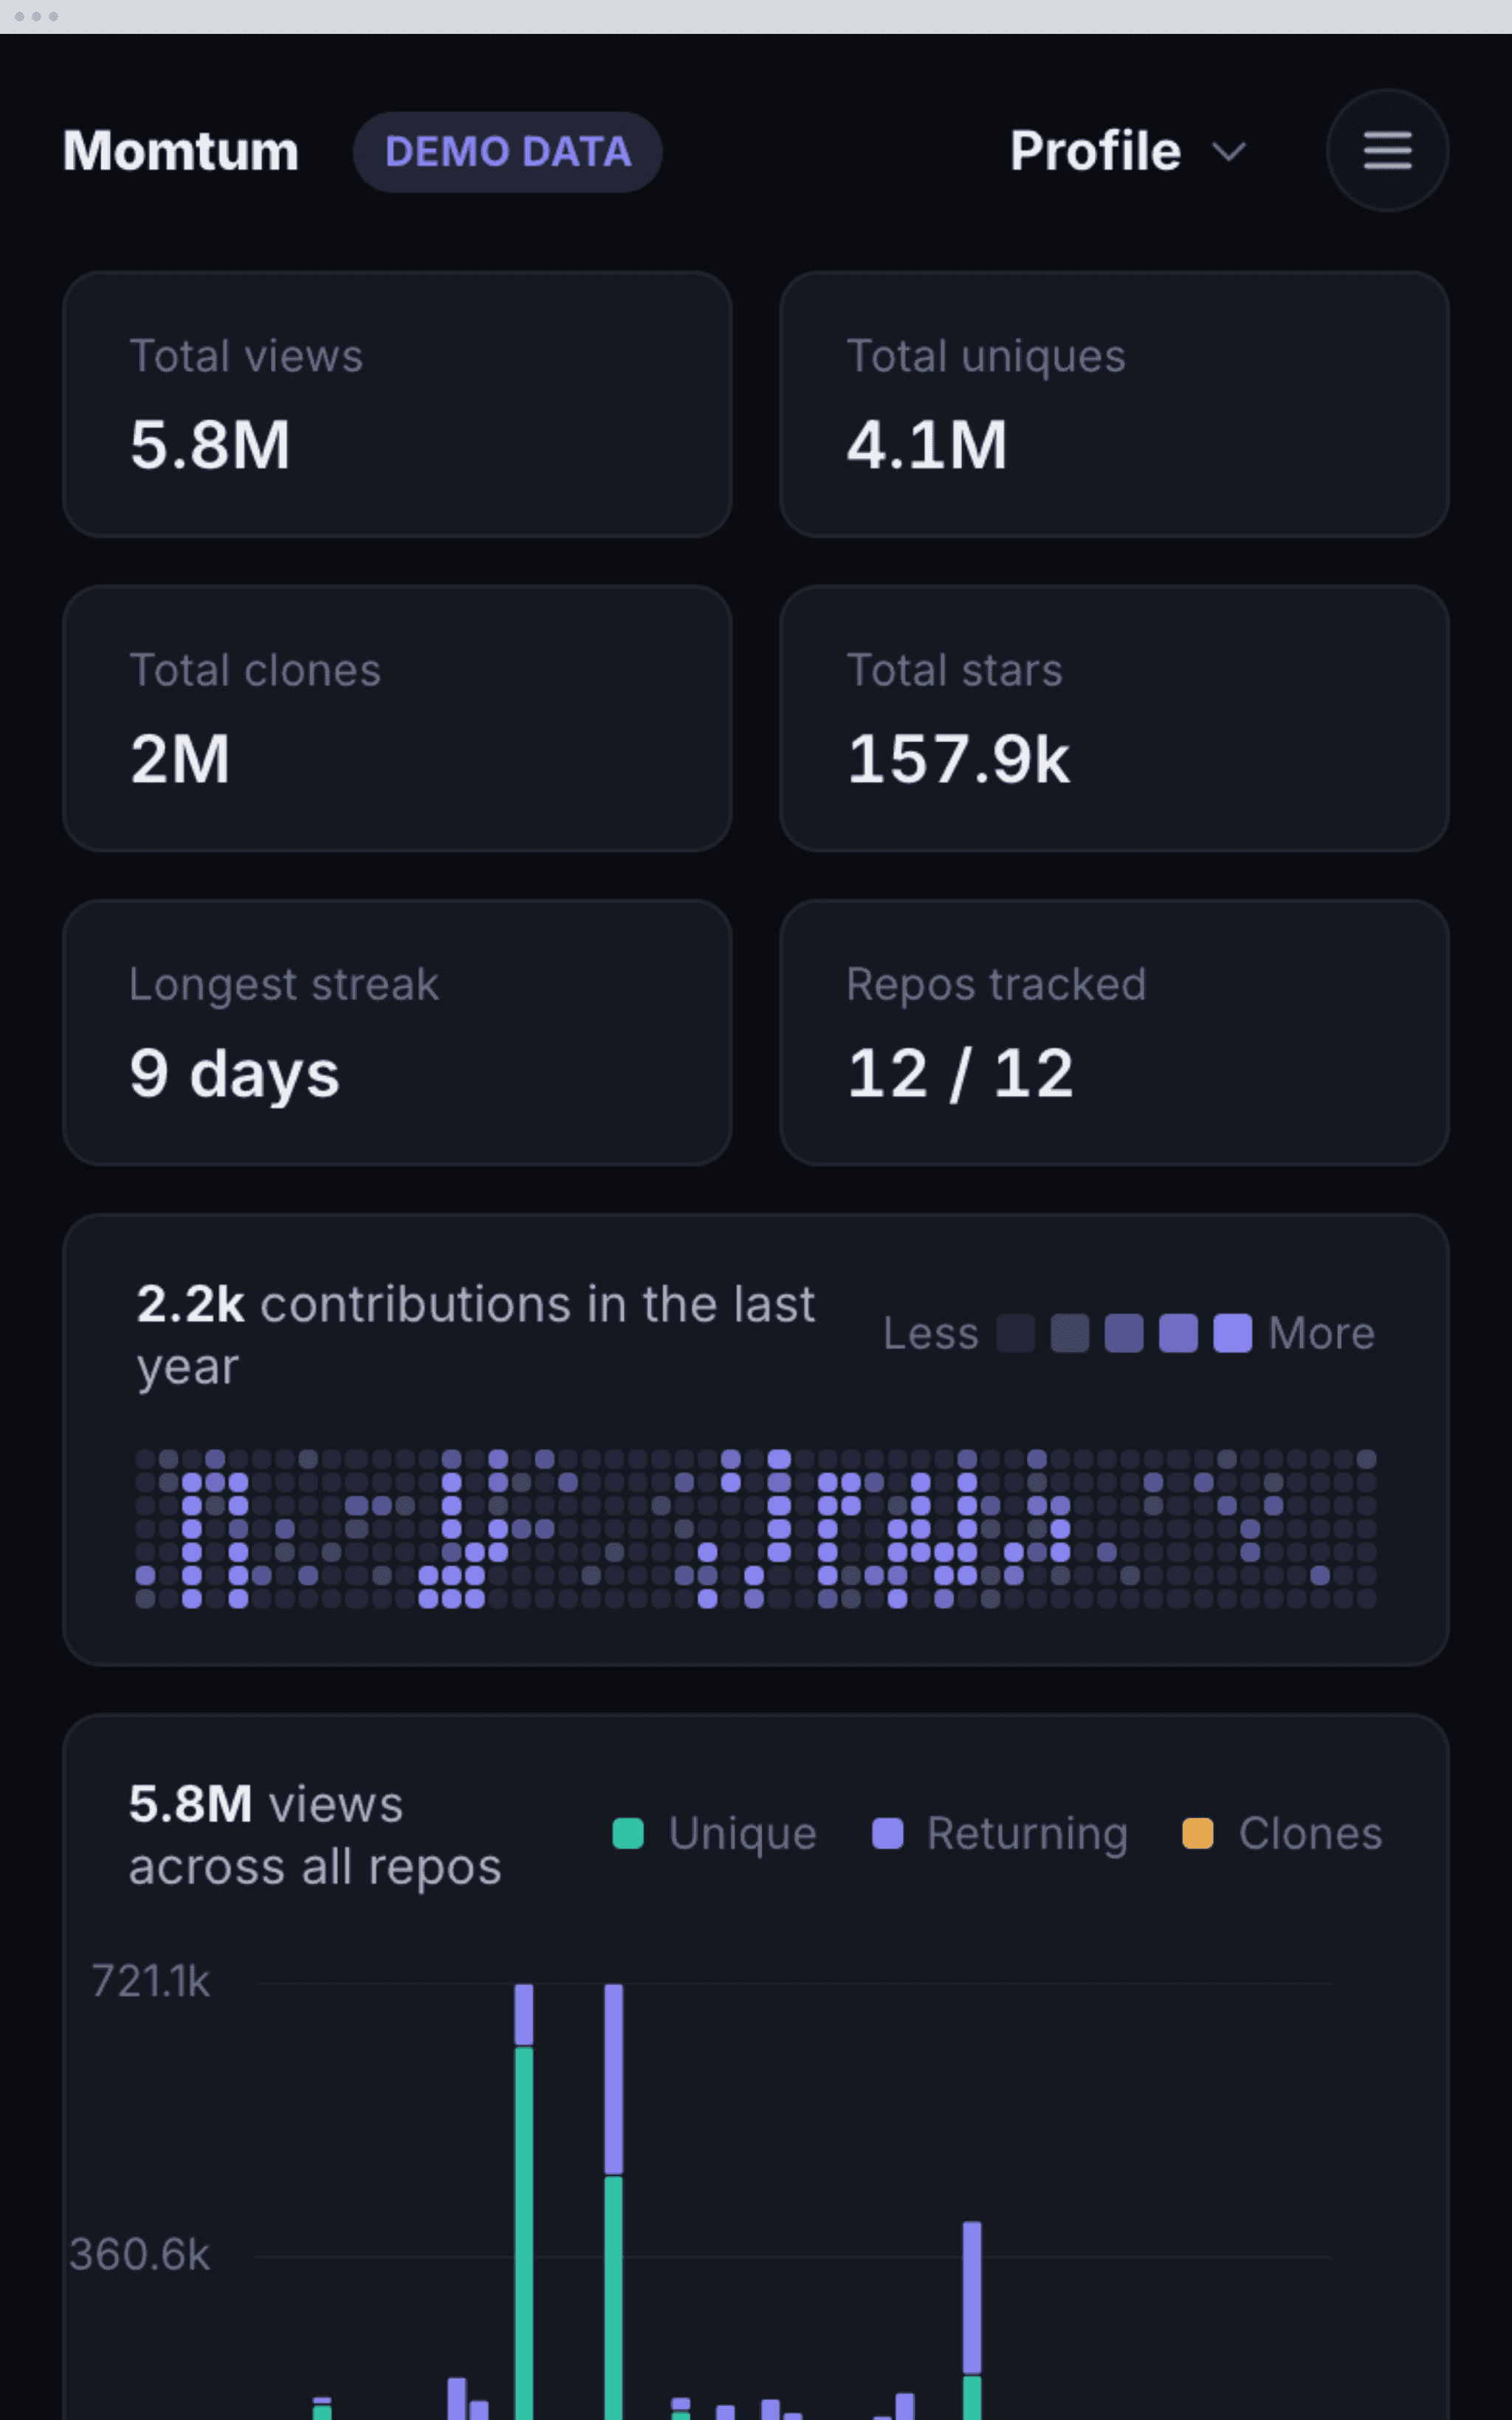
What Gets Written Down
Momtum copies the window out once a week, while the data still exists. The schedule matters more here than the features do.
GitHub keeps
- A trailing fourteen days, reset as it is read
so once a week Momtum copies out
- Views and clones, every day in the window
- Referrers and paths, whoever sent them
- Stars, forks, issues, contributors, language
and what gathers behind it is
- Every week since the first run, each day dated when it happened
Two Phases, One Boundary
The data is not neutral. Referrer strings, popular paths and repository descriptions are text other people can set, and all of it arrives in the response body. Anything that reads it and also has a shell is one well written sentence from running something nobody asked for.
So the sync is split in two. The boundary is not a filter trying to recognize a bad string; it is an arrangement where the dangerous text and the capability to act never share a room.
It stores no token either, using sessions already on the machine, so there is no secret in the repository to leak.
The two halves never share a room. Everything a stranger can write reaches disk and stops there; what crosses to the writing phase is a list of paths, and the phase that reads it has one tool and no shell.
What Runs When Nobody Is Watching
A weekly job that quietly stops is worse than no job: the gap shows up later as missing months. So a run that cannot finish fails instead of advancing its own clock, and the next one tries the same week again.
A run prepares
- A counted number of documents
and the writing phase reports back
- The number it actually wrote
and the run either
- Agrees: the week is recorded and the clock moves
- Does not: the run fails, what was fetched is kept, and tomorrow tries the week again
Notes
Impact
Tools
- JavaScript
- HTML & CSS
- Shell, opens in a new tab
- GitHub CLI, opens in a new tab